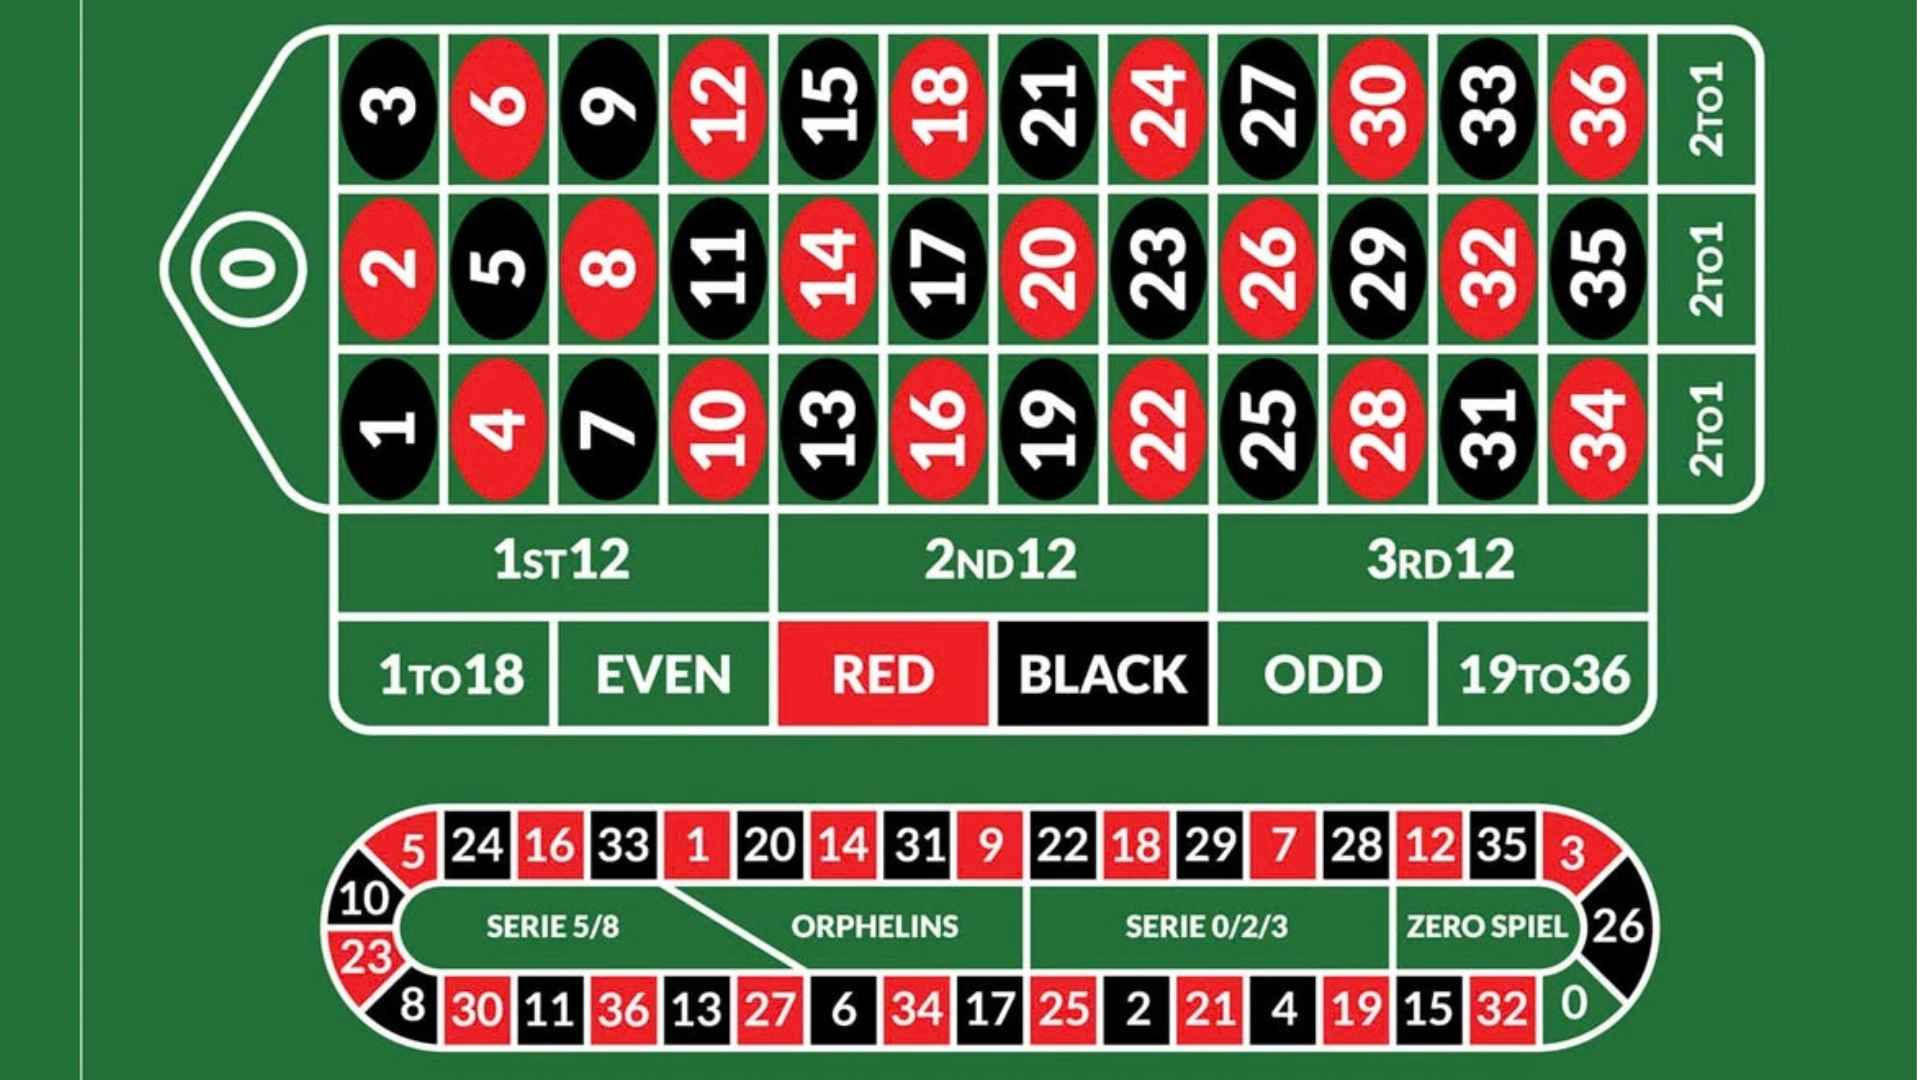
When watching random number draws or lotteries, observers are frequently surprised to see consecutive digits appear back-to-back, such as 23 and 24. While human intuition often flags these occurrences as rare anomalies, probability theory reveals a completely different reality. Understanding the likelihood of drawing adjacent numbers in a row provides valuable insight into combinatorial mathematics and the nature of true randomness.
The Mathematical Reality Behind Consecutive Pairs
Human perception often assumes that random selections should spread out evenly across an entire numerical range. However, mathematical probability proves that adjacent pairs occur far more frequently in random draws than most people expect. In a standard lottery draw picking six numbers out of forty-nine, the chance of at least two consecutive numbers appearing is actually greater than fifty percent.
This surprising frequency is rooted in combinatorics, which measures the number of possible unique combinations within a set. When evaluating total pool outcomes, the number of groupings containing at least one consecutive pair turns out to be substantial. As a result, seeing adjacent digits drawn in sequence is a normal statistical feature rather than a strange coincidence.
Psychological Perception versus Statistical Distribution
The surprise people experience when seeing sequential numbers stems from a common cognitive illusion known as the clustering illusion. Human minds naturally search for patterns and tend to view structured sequences as non-random. Consequently, sequences like 14 and 15 feel intentional, whereas randomly scattered numbers appear more authentic.
In reality, standard pseudo-random number algorithms and physical draw mechanisms treat every valid combination with identical mathematical weight. A set containing adjacent numbers has the exact same probability of being selected as a set with widely spaced digits. Over thousands of trials, numerical clusters appear regularly as a natural property of uniform probability distribution.
Calculating Odds in Multi-Digit Draws
Calculating the exact probability of adjacent draws involves evaluating total potential combinations against those without consecutive numbers. Mathematicians use complementary probability formulas to determine how many selection paths avoid adjacent pairings altogether. Subtracting these non-consecutive arrangements from total possible outcomes yields the exact odds of sequential hits.
As the count of drawn balls increases relative to the total pool size, the likelihood of drawing adjacent numbers rises significantly. For instance, selecting more numbers from a smaller range drastically elevates the statistical certainty of consecutive pairs. Recognizing this structural dynamic helps enthusiasts analyze draw outcomes with analytical clarity.
Practical Insights for Data and Probability Enthusiasts
Grasping how consecutive numbers function within random distributions helps individuals avoid common pitfalls in data interpretation. Misinterpreting sequential draws can lead observers to falsely assume that system algorithms are biased or broken. In truth, recognizing these patterns reinforces an objective understanding of statistical variance.
Whether tracking historical data sets or studying basic probability theory, recognizing sequential frequency provides a grounded perspective on numerical behavior. Pure randomness inherently includes clustering, sequence runs, and adjacent outcomes. Embracing these mathematical principles allows analysts and casual observers alike to evaluate random selection systems accurately.